Most ROI calculators for venue software are marketing instruments. You enter three figures, a vendor's assumed uplift percentage does the work behind the curtain, and a large green number appears. It will not survive a finance conversation, because the number it produced was never about your deck.
A model that does survive takes eight inputs from your own operation, applies four revenue levers you can each explain, subtracts four cost lines, and states what it assumed. It fits on one spreadsheet tab. Below is how to build it.
The direct answer: how to calculate ROI on booking software
Take your own inputs — units and rates by zone, operating days, current occupancy, current online share, current no-show rate, current add-on attach rate, and abandoned checkouts. Model four revenue levers against them: recovered no-shows, higher add-on attach, dynamic pricing on peak dates, and recovered abandoned bookings. Subtract platform commercials, any transaction element, payment processing, and implementation time. Present the conservative case.
The eight inputs
Collect these before you open a spreadsheet. Every one of them is a number you already have or can pull in an afternoon.
| # | Input | Where it comes from |
|---|---|---|
| 1 | Bookable units, by zone | Your floor plan: front row, swim-up, shade line, lawn |
| 2 | Rate per unit, by zone | Your current rate card |
| 3 | Operating days per year, and how often the furniture sells per day | Your calendar — a day where the same daybeds sell twice counts twice |
| 4 | Current average occupancy, by zone | Your best available figure, split peak and off-peak |
| 5 | Share of bookings currently taken online | Versus walk-up, phone, and DM |
| 6 | No-show or walk rate on unpaid holds | Your reservation records |
| 7 | Current add-on attach rate and average add-on value | Bottles, cakes, transfers, packages |
| 8 | Started-but-abandoned checkouts | Only if you can measure it today |
One rule governs all eight: if you do not know a number, set that lever to zero. A lever at zero makes the model smaller and makes it true. Borrowing an industry average makes it bigger and makes it worthless, because the first question anyone senior asks is where the number came from.
The worked figures below are placeholder digits chosen to show the shape of each calculation. They are not benchmarks, not averages, and not claims about what your venue will do. Replace every one of them.
Lever 1 — units that walk
Start with the exposure, then with how much of it you can convert.
Annual exposure = units × average rate × no-show rate × operating days
Recovered       = exposure × share of bookings you move to prepaid
With 60 units at an average $200, a 5% walk rate, and 300 operating days, the exposure is $180,000 a year. If prepayment, deposits, and minimum spends cover 60% of your bookings, the recovered figure is $108,000. A $450 daybed that walks at 2pm is $450 you never see again; the point of the arithmetic is that it happens at a scale nobody totals up until they do.
Two honesty checks. Prepayment does not convert 100% of walks, so do not model it that way. And the recovered amount is capped by what you were actually going to sell — a unit that walks on a day you were half empty was not lost revenue, it was unsold inventory.
Lever 2 — add-on attach
Uplift = annual bookings × (target attach − current attach) × average add-on valueIf you take 18,000 bookings a year, current attach is 20%, target is 30%, and the average add-on is $60, the uplift is $108,000. Set your target from what your own top-performing weekends already achieve, not from an aspiration.
What changes attach in a booking flow is placement: add-ons presented inside the journey, with full-screen bottle video and swipeable product discovery, in front of every booker at the moment they are planning an occasion — rather than sold by a floor team under time pressure. That is a mechanism, not a multiplier. You still supply the number.
Lever 3 — dynamic pricing
Apply this only to dates that already sell out, and only to the units that sell first.
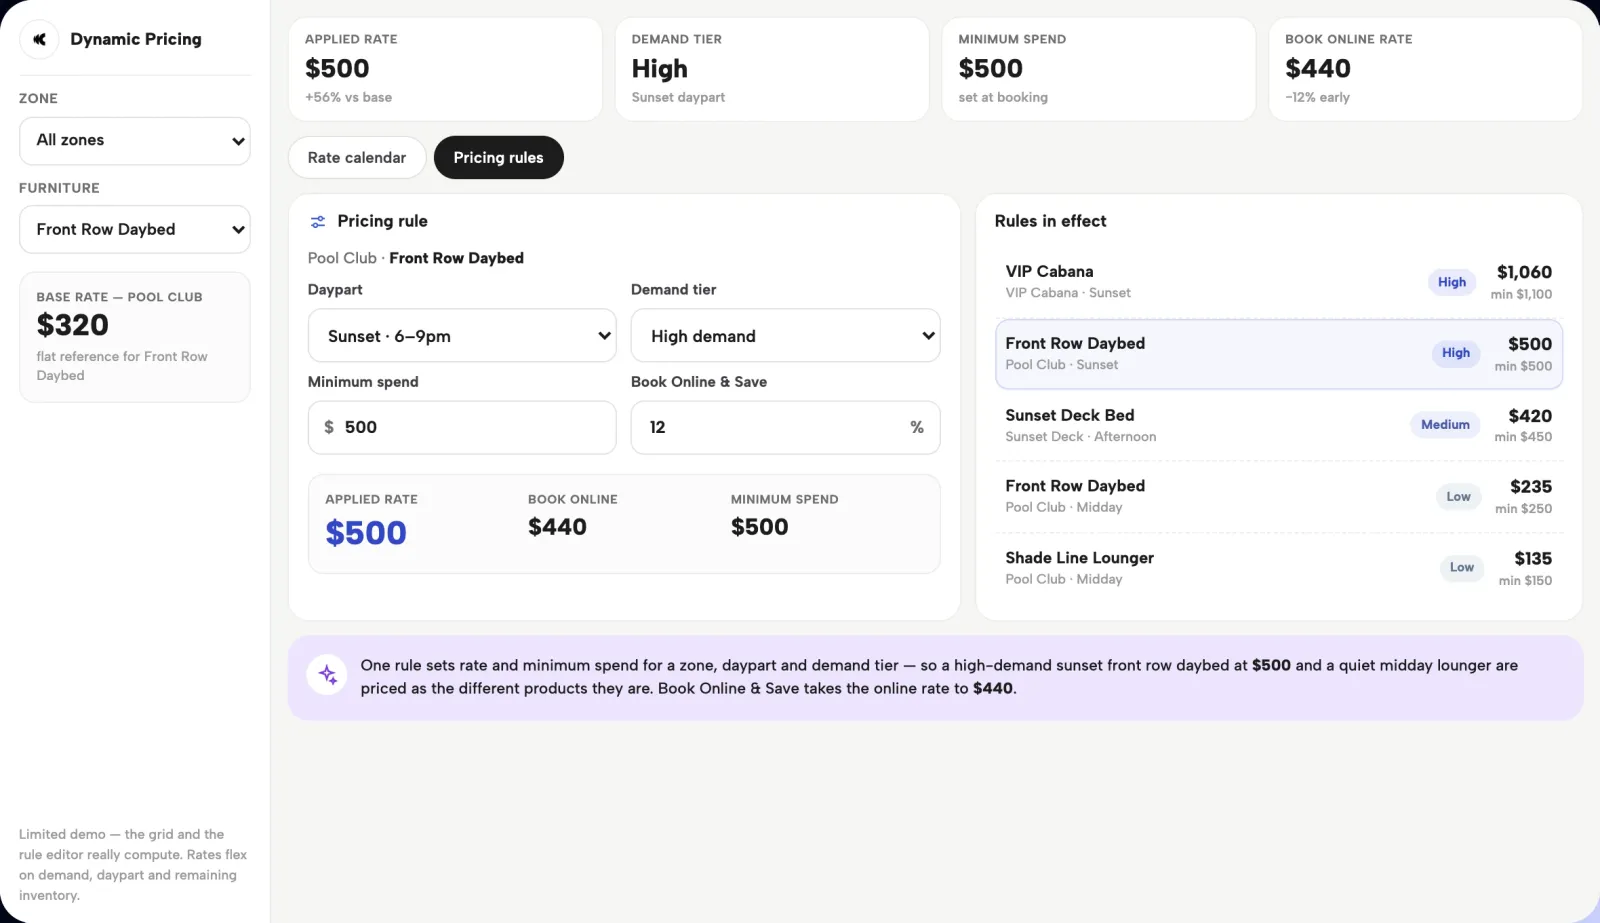
Uplift = peak dates × units sold on those dates × price uplift per unitForty peak dates, 40 units sold on each, at $30 more per unit is $48,000. The discipline is in the scope: pricing to demand earns more from the same seats on the dates where demand exceeds supply. Applied to all 300 operating days it is not dynamic pricing, it is a price rise, and it will show up as lost volume. The method, including guardrails, is in dynamic pricing for beach clubs.
Lever 4 — recovered abandoned bookings
Recovered = started checkouts × abandonment rate × recovery rate × average booking valueThis is the lever most venues cannot populate on day one, because a DM inbox has no concept of an abandoned checkout. If you cannot measure started checkouts today, set it to zero, and revisit after go-live when the events exist. When it is running, abandoned-cart events fire within seconds and WhatsApp and email return the guest to the exact zone, date, and price they left.
The denominator: four cost lines
Model the cost side as four separate lines, because only the first one usually gets discussed:
- Platform commercials. These come out of discovery, scoped to your inventory, zones, payments, integrations, teams, and rollout work. Do not use a placeholder from a competitor's price page — get the actual number and put it in.
- Any transaction element, if the commercial model has one.
- Payment processing. Your gateway's own rate, which sits outside the platform fee. A payment gateway is mandatory for online transactions, so this line appears in any scenario where you sell online — including the one where you switch vendors rather than platforms.
- Implementation and internal time. Building the venue map, loading products and packages, configuring rates, and training the floor team. Count the hours at a real internal rate.
The model, live
Run the four levers on your own numbers
The prefilled digits are the article's placeholder digits — they show the shape of the arithmetic, not benchmarks. Replace every one. If you cannot source an input, clear its field: the lever stays at zero. Everything is computed in your browser, and nothing you type leaves this page.
Never count a dollar twice: a recovered no-show that also buys a bottle appears in lever 1 and lever 2. If your inputs overlap, reduce one.
The denominator is empty, so this is gross uplift, not ROI. Platform commercials come out of discovery — bring your eight inputs and get the real number.
Run it three times — conservative, base, stretch — and lead with the conservative one. Then true it up against real reporting after 60 to 90 days.
Get your commercials numberThe interactive model needs JavaScript — the formulas above are the same arithmetic on one spreadsheet tab.
Four rules that keep the model honest
Never count a dollar twice. A recovered no-show that also buys a bottle appears in lever 1 and lever 2. Pick one, or apply the add-on uplift only to bookings that were not already counted as recovered.
Model three cases and present the conservative one. Conservative, base, and stretch, each with its assumptions written next to it. Leading with the conservative case is what makes the base case believable.
Baseline properly. Compare the same period year over year, not this month against last month. Seasonality will otherwise hand you an uplift you did not earn — or hide one you did.
State a payback horizon. How many months until cumulative net gain exceeds cumulative cost. A model without a payback number is a wish.
True it up against actuals
The model is a hypothesis, and after 60 to 90 days you can replace assumptions with measurements. Twenty-plus reports cover the inputs you guessed at: daily booking volume, lead time by zone, average value by variant, product mix, repeat-customer share, and origin markets, segmented and trending without CSV exports.
Paid marketing gets the same treatment. Bookings fire to Meta, Google, TikTok, and GA4 in real time with revenue values posted back, so return on ad spend is measured against booking revenue rather than against clicks. The wider revenue architecture these levers sit inside is set out in the beach club revenue playbook, and the revenue tools page covers what runs each one.
What to leave out
Industry averages you cannot source. Vendor case-study uplifts from venues that are not yours. Soft benefits like saved staff hours, unless you convert them to a number you would defend. And anything already counted in another lever. A smaller model you can defend line by line beats a large one that collapses under the first question.
Questions operators ask
How do you calculate ROI on a beach club booking system?
Build the return from four levers using your own inputs — recovered no-shows, higher add-on attach, dynamic pricing on peak dates, and recovered abandoned bookings — then subtract four cost lines: platform commercials, any transaction element, payment processing, and implementation plus internal time. Present the conservative case with assumptions written next to each figure, and state a payback horizon in months.
What inputs do I need before I can model it?
Eight: units by zone, rate by zone, operating days and how often the furniture sells per day, current occupancy, the share of bookings currently taken online, your no-show rate on unpaid holds, your current add-on attach rate and average add-on value, and abandoned checkouts if you can measure them. Any input you cannot source should leave its lever at zero.
Should I use industry benchmarks in the model?
No. Beach club benchmarks are scarce, rarely comparable across markets and venue types, and the first thing a finance conversation will challenge. A model built on your own unit counts, rates, and operating days is smaller and holds up. Where a number genuinely is not available, leave the lever at zero rather than borrowing an average.
How long before a booking platform pays for itself?
That depends on your inventory value, your current no-show and attach rates, and the commercials scoped to your venue, so calculate it rather than accepting a stated figure. Divide cumulative net gain by month into cumulative cost and read off the crossover. Then re-run it after 60 to 90 days of real reporting, replacing every assumption you can measure.
What does the platform cost, so I can complete the model?
Commercials follow discovery. Every venue has a different mix of inventory, zones, payments, integrations, teams, and rollout work, so we map the operation on a call and come back with a proposal built around the real scope — a number you can put straight into the denominator instead of a placeholder.
Can I build this without new software?
Yes, and you should. The model is a spreadsheet: one tab of inputs, one of levers, one of costs. Building it first tells you which levers actually matter at your venue, which turns a vendor demo into a specific conversation about the two or three that move your numbers rather than a tour of a feature list.
Bring your eight inputs to the call. We will run them against the platform configured for a venue like yours and give you a commercials number to complete the model. Book a 30-minute demo — no contracts, no credit card.